Your dropshipping business at a glance
Revenue · Orders · Top products · Supplier metrics
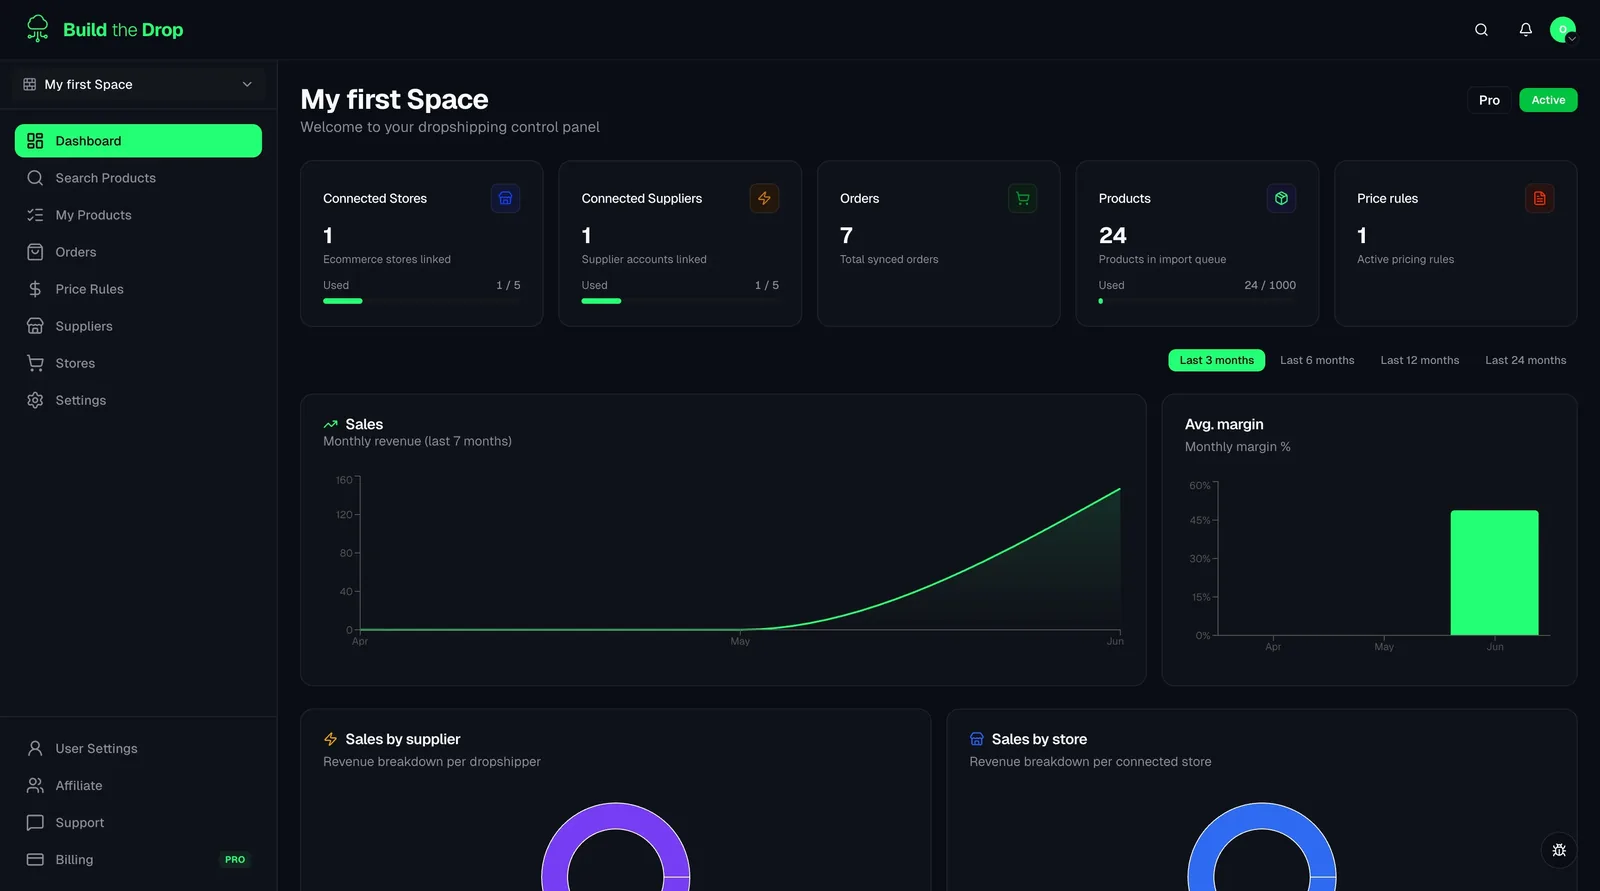
Build the Drop's analytics dashboard gives you a clear view of your store's performance: revenue trends, order volume, average margin and sales by supplier and by store — kept up to date automatically.
Available from the Starter plan
Auto
data refresh
All
stores in one view
Supplier
metrics included
What you get with Dashboard Analytics
All the tools you need, built into your dropshipping dashboard.
Revenue and order trends
Track daily, weekly and monthly revenue and order counts. Spot trends, identify seasonality and catch drops before they become problems.
Top products by revenue and volume
See which products are generating the most revenue and the most orders. Identify your winners and double down — or spot your losers and cut them.
Supplier performance metrics
Track which suppliers are shipping fastest, which have the most order issues, and which products have the most stock fluctuation. Make data-driven sourcing decisions.
Multi-store comparison
If you run multiple Spaces, see performance side by side across all stores. Identify which brands or niches are performing best and allocate focus accordingly.
How it works
Data flows in automatically
As orders come in through Shopify and are fulfilled via Build the Drop, all data is captured automatically — no manual reporting needed.
Open the Dashboard
The dashboard is your default landing page in Build the Drop. Key metrics are visible immediately without configuration.
Drill down into products and suppliers
Click into any metric to see the underlying detail — which products, which suppliers, which time periods are driving the numbers.
Frequently asked questions
Know your numbers. Grow with confidence.
Build the Drop's analytics are included in every plan. No extra setup required.